Key Takeaways
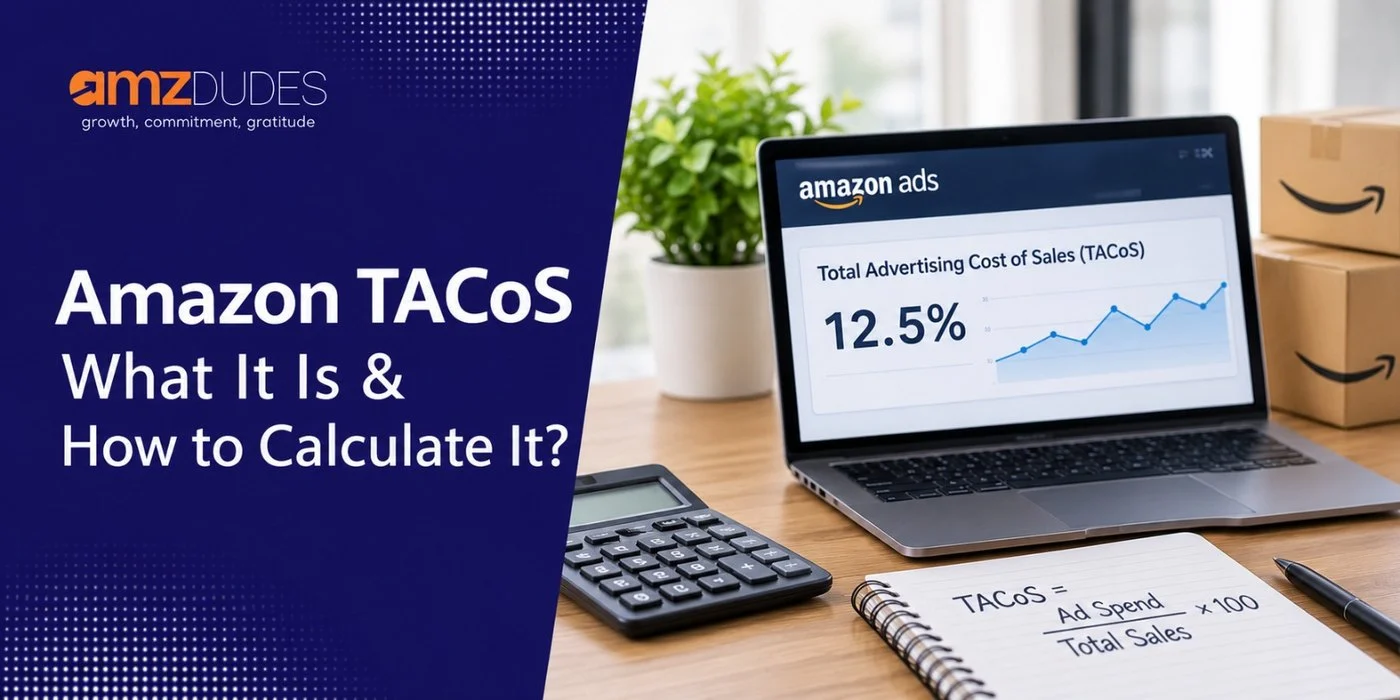
- TACoS = total ad spend ÷ total sales × 100. Unlike ACoS, it includes organic sales, so it shows how dependent your business is on advertising.
- Read ACoS and TACoS together. A stable ACoS with a rising TACoS usually means organic sales are slipping, even though your campaigns look fine.
- There is no universal “good” TACoS. Common benchmarks put the ideal range around 5 to 10 percent and the average around 10 to 15 percent, but your margin and product stage matter more than any category number.
- A simple profitability check: if your TACoS is lower than your profit margin before advertising, your business is profitable after ad spend.
- The trend matters more than the number. A falling TACoS while revenue grows is the clearest sign your advertising is building lasting organic sales.
Most Amazon sellers learn ACoS first. It is the number shown in every campaign report, and it tells you how efficiently your ads convert spend into sales. But ACoS only looks at sales that Amazon ties directly to an ad click. It says nothing about what happens to the rest of your business.
That is the gap Amazon TACoS fills. By comparing your ad spend with all of your sales, TACoS shows whether advertising is building organic momentum or simply buying sales you would have struggled to get any other way. It is the metric that tells you whether your ads are growing the business or just keeping it afloat.
This guide covers what TACoS is, how to calculate it correctly, how it compares with ACoS and ROAS, what a healthy TACoS looks like for your margin and product stage, and how to improve it without hurting growth.
What Is Amazon TACoS?
TACoS (Total Advertising Cost of Sale) Explained
TACoS measures your advertising spend as a share of your total revenue. If you spent $5,000 on ads last month and sold $50,000 worth of products in total, your TACoS was 10 percent. One dollar in every ten you earned went back into advertising.
The word “total” is what matters. Total sales include:
- Ad-attributed sales: orders Amazon credits to a Sponsored Products, Sponsored Brands, or Sponsored Display click
- Organic sales: orders from shoppers who found you through organic search, browsing, your Brand Store, or repeat purchases without clicking an ad
Because it includes both, TACoS answers a bigger question than ACoS: how much does it cost, in advertising, to run your entire Amazon business?
Why ACoS Alone Gives You an Incomplete Picture
ACoS (Advertising Cost of Sale) divides ad spend by ad-attributed sales only. It is useful for judging individual campaigns, keywords, and bids, and you should keep using it for that. Our complete guide to ACoS covers it in detail.
The problem is what ACoS leaves out. Imagine two sellers, each running campaigns at a 25 percent ACoS. One is steadily gaining organic rank, and organic sales are growing every month. The other is losing organic rank, and advertising is propping up a shrinking business. Their campaign reports look identical. Their businesses are heading in opposite directions.
TACoS is how you tell them apart.
The Organic Halo: How Ads Lift Sales You Don’t See in Ad Reports
Advertising on Amazon does more than generate the sales attributed to clicks. When your ads drive sales on a keyword, Amazon’s algorithm sees more sales velocity for your product on that search. Over time, that can improve your organic ranking for the same keyword, which brings in organic sales that never appear in your advertising reports.
This effect is often called the organic halo. It is one of the main reasons TACoS matters, because TACoS reflects total revenue rather than attributed sales alone; when the halo is working, organic sales grow faster than ad spend, and TACoS falls. When it is not, TACoS stays flat or rises even if campaigns look efficient.
How to Calculate Amazon TACoS
The TACoS Formula
TACoS = (Total Ad Spend ÷ Total Sales) × 100
- Total ad spend is everything you spent on Amazon advertising in the period: Sponsored Products, Sponsored Brands, Sponsored Display, and Amazon DSP if you run it.
- Total sales is all revenue for the same period, from both ad-attributed and organic orders.
Worked Example: Calculating TACoS Step by Step
Here is an illustrative month for a single brand:
| Item | Amount |
| Sponsored Products spend | $4,500 |
| Sponsored Brands spend | $1,000 |
| Sponsored Display spend | $500 |
| Total ad spend | $6,000 |
| Ad-attributed sales | $18,000 |
| Organic sales | $32,000 |
| Total sales | $50,000 |
ACoS = $6,000 ÷ $18,000 × 100 = 33.3 percent
TACoS = $6,000 ÷ $50,000 × 100 = 12 percent
Looked at alone, a 33 percent ACoS might seem high. But the TACoS shows that advertising costs 12 percent of total revenue, and that organic sales make up nearly two-thirds of the business. That is a very different picture of the account’s health.
Where to Find Your Ad Spend and Total Sales in Seller Central
Ad spend: Go to the Amazon Ads console (Campaign Manager), set your date range, and add up spend across all campaign types. For a fuller view, download the Sponsored Products, Sponsored Brands, and Sponsored Display reports for the same period. If you run DSP, add that spend from the DSP console.
Total sales: In Seller Central, go to Reports, then Business Reports, then Sales and Traffic. Use the “Ordered Product Sales” figure for the same date range. Vendor Central sellers should use shipped or ordered revenue from Retail Analytics, applied each period consistently.
Track both figures in a simple spreadsheet each week or month so you can watch the trend rather than a single snapshot.
Account-Level vs. Product-Level TACoS
Account-level TACoS tells you how dependent your whole business is on advertising. It is the right number for budget planning and for reporting to leadership.
But a healthy account average can hide problems. One hero product with strong organic rank and a 4 percent TACoS can mask three newer products running at 35 percent. To find them, calculate TACoS at the product or product-group level:
- Product ad spend: the Advertised Product report in the Amazon Ads console
- Product total sales: the Detail Page Sales and Traffic by Child Item report in Business Reports
It is one of the most useful applications of TACoS, because it shows how dependent each product is on advertising. Products with a persistently high TACoS are the ones whose listings, pricing, or organic rank most need attention.
Common Calculation Mistakes
Mismatched date ranges: If ad spend covers the 1st to the 30th and sales cover the 1st to the 31st, your TACoS will be slightly off. Use identical ranges every time.
Leaving out ad types: Counting only Sponsored Products spend understates TACoS. Include Sponsored Brands, Sponsored Display, and DSP so the number reflects your true advertising cost.
Using the wrong sales figure: Mixing ordered sales one month with shipped or net-of-refunds sales the next makes trends meaningless. Pick one definition and stick with it.
Comparing different marketplaces together: TACoS for amazon.com and amazon.co.uk should be tracked separately, since competition, CPCs, and currencies differ.
Reading single days: Daily TACoS swings with promotions, stock changes, and reporting lag. Weekly or monthly views show the real direction.
TACoS vs. ACoS vs. ROAS
Side-by-Side Comparison
| ACoS | TACoS | ROAS | |
| Formula | Ad spend ÷ ad-attributed sales × 100 | Ad spend ÷ total sales × 100 | Ad-attributed sales ÷ ad spend |
| What it measures | Campaign efficiency | Ad dependence of the whole business | Return per ad dollar |
| Includes organic sales? | No | Yes | No |
| Best used for | Bids, keywords, campaign decisions | Budget planning, growth health, product strategy | Comparing ad performance across channels |
| Example (from Section 2) | 33.3% | 12% | 3.0x |
ACoS and ROAS are two views of the same thing: ROAS is the inverse of ACoS. A 25 percent ACoS equals a 4.0x ROAS. TACoS is the only one of the three that brings organic sales into the picture.
When ACoS Looks Fine, but TACoS Signals a Problem
Consider this illustrative comparison across two months:
| January | April | |
| Ad spend | $5,000 | $5,000 |
| Ad-attributed sales | $20,000 | $20,000 |
| Organic sales | $40,000 | $20,000 |
| Total sales | $60,000 | $40,000 |
| ACoS | 25% | 25% |
| TACoS | 8.3% | 12.5% |
Every campaign report would say nothing changed. ACoS held steady at 25 percent. But organic sales halved, total revenue dropped by a third, and TACoS rose by more than four points. Something outside the campaigns went wrong, perhaps a drop in organic rank, a lost Buy Box, a stockout, a suppressed listing, or a new competitor.
Without TACoS, a seller watching only ACoS would not see the problem until revenue fell sharply.
Reading ACoS and TACoS Together: The Four Trend Scenarios
The most useful way to use TACoS is alongside ACoS, watching which direction each is moving over several weeks.
| ACoS | TACoS | What It Usually Means | What to Do |
| Falling or stable | Falling | Ads are efficient and organic sales are growing. Your advertising is building lasting rank. | Keep going. Consider scaling campaigns that are driving the growth. |
| Rising | Falling | Campaigns are less efficient, but organic sales are growing faster. Common during a deliberate growth or launch push. | Fine if planned. Set a time limit and watch that organic growth continues. |
| Falling or stable | Rising | Campaigns look fine, but organic sales are shrinking. Ads are replacing lost organic sales. | Investigate outside the ads: organic rank, Buy Box, stock, listing health, pricing, competitors. |
| Rising | Rising | You are spending more and getting less, and organic sales are not responding. | Fix campaign structure, cut waste, and review listing conversion before adding budget. |
What a Healthy TACoS Looks Like
Common Benchmark Ranges (and Why They’re Only a Starting Point)
A TACoS of 5 to 10 percent is an ideal scenario, 10 to 20 percent reflects a fair level of advertising to boost sales, and above 20 percent is a worrying sign. ZonGuru notes that most sellers fall in the 10 to 15 percent range, and warns that a very low TACoS of 1 to 2 percent may simply mean a seller is underusing advertising rather than succeeding without it.
These ranges are a useful reference point, but they are not targets. A 15 percent TACoS can be excellent for a high-margin product in a growth phase and a problem for a low-margin product that has been on the market for three years. Three factors decide what healthy looks like for you.
Healthy TACoS Depends on Your Margin: The Profitability Rule
If your TACoS is lower than your organic profit margin, your business is profitable after advertising. Organic profit margin here means your profit before any ad spend, after product costs, Amazon fees, and other variable costs.
Here is how it works in practice:
| Product A | Product B | |
| Profit margin before advertising | 35% | 18% |
| TACoS | 14% | 14% |
| Margin after advertising | 21% | 4% |
Both products have the same TACoS. Product A keeps a healthy profit after advertising. Product B is barely profitable, and a small rise in TACoS would push it into a loss. The same TACoS means very different things depending on margin.
Work out your profit margin before advertising for each product, then treat it as the ceiling for TACoS. The gap between the two is your profit after ads.
Healthy TACoS by Product Stage: Launch, Growth, and Mature
Your product’s stage changes what a healthy TACoS should be. The ranges below are illustrative starting points, not industry statistics. Set your own based on margin and goals.
| Stage | What’s Happening | Illustrative TACoS Expectation | What Healthy Looks Like |
| Launch (first 1 to 3 months) | Little organic rank, few reviews, ads drive most sales | High, often 25% or more, and temporary | Spend is time-boxed, and organic sales start appearing |
| Growth | Organic rank building on priority keywords | Moderate, roughly 12 to 20% | TACoS trending down month over month as organic sales grow |
| Mature | Strong organic rank and reviews, ads defend and extend | Lower, roughly 5 to 12% | Stable or slowly falling TACoS with steady revenue |
A launch product running at 30 percent TACoS is not a problem if the plan is to build rank and the number is falling by month three. A mature product sitting at 30 percent for a year is a problem, because advertising should be supporting an established organic base by then.
Why the Trend Matters More Than the Number
A single TACoS figure tells you where you are. The trend tells you where you are going. A brand with a 16 percent TACoS that has fallen from 22 percent over six months while revenue grew is in a stronger position than a brand sitting at 9 percent that has crept up from 6 percent while revenue stalled.
Track TACoS weekly or monthly and look at it alongside total revenue. The healthiest pattern is a falling or stable TACoS while total revenue rises. That combination means organic sales are carrying more of the business each month.
Where TACoS Falls Short: What It Doesn’t Tell You
TACoS is valuable, but it has blind spots:
- It ignores margin: TACoS can look healthy while a low-margin product loses money. Always read it next to profit margin.
- It can be gamed by cutting spend: Cut your ad budget in half and TACoS will fall immediately, but organic rank may erode over the following weeks and total revenue may drop. A lower TACoS is only good if revenue holds or grows.
- It hides absolute revenue changes: ACoS and TACoS can both stay flat while total revenue falls. Always look at the dollar figures too.
- It doesn’t explain the cause: TACoS tells you something changed, not what. A rising TACoS could come from a stockout, a lost Buy Box, a new competitor, or a weaker listing. You still need to diagnose.
- It stops at Amazon: If you also run Google, Meta, or TikTok ads that send traffic to Amazon, consider a broader measure such as marketing efficiency ratio (MER) to capture total marketing cost against total revenue.
How to Improve Your TACoS Without Shrinking Your Business
There are two ways to lower TACoS: spend less on ads, or grow total sales faster than ad spend. Only the second builds a stronger business. The steps below focus on that.
Improve Listing Conversion and Organic Rank
The fastest way to lower TACoS for the right reasons is to convert more of the traffic you already have. A higher conversion rate means more sales from the same ad spend, and more sales velocity means stronger organic rank over time.
Focus on the elements shoppers judge first:
- Main image that stands out against competitors in search results
- Title with your primary keyword early and written for shoppers, not just the algorithm
- Bullets and A+ Content that answer the questions holding buyers back
- Reviews and ratings, using compliant review programs to build credibility
- Price that is competitive for the value you offer
Conversion improvements compound. In our Beauty & Personal Care case study, conversion rate rose from 23.37 to 30.65 percent as listing, bundle, and advertising work came together, and revenue grew from $1.45M to $2.61M. Gains like that let organic sales grow alongside ad sales. Our Amazon SEO and listing optimization guide covers the details.
Cut Wasted Ad Spend
Every dollar spent on clicks that never convert raises TACoS without adding sales. Review your search term report weekly and:
- Add negative keywords for irrelevant or non-converting searches
- Pause or lower bids on keywords with many clicks and no orders
- Move proven converting search terms from auto and broad campaigns into exact match, where you control the bid
- Check placement performance and reduce bid modifiers where placements are expensive and do not convert
Our guide to finding negative keywords walks through the weekly process.
Manage Budgets at the SKU Level
Calculate TACoS by product and use it to decide where the next dollar goes:
- Low TACoS, strong organic rank: these products need less support. Shift some budget away and watch whether organic sales hold.
- High TACoS, improving trend: these are investments that are working. Keep funding them while the trend continues.
- High TACoS, flat or rising trend: these products need listing, pricing, or positioning fixes before more ad spend.
Spreading budget evenly across a catalog is one of the most common reasons account-level TACoS stays high.
Run Brand Defense Efficiently
Brand defense campaigns, which bid on your own brand name and place ads on your own product pages, usually run at a very low ACoS. They protect sales from competitors bidding on your brand. But some of those shoppers would have bought from you organically anyway.
Keep brand defense in its own campaigns so you can see its cost separately. Bid enough to hold the top position on your brand terms, but avoid overspending on searches where you already rank first organically and no competitor is bidding. This keeps the defensive part of your TACoS lean.
Why Cutting Ad Spend to Lower TACoS Can Backfire
It is tempting to lower TACoS by slashing ad budgets. The number improves immediately, which looks good in a report. But ads are often what keep your products visible on high-volume keywords. Remove them suddenly and sales velocity drops, organic rank slips, and organic sales follow a few weeks later. TACoS may then climb back up on a smaller revenue base.
If you want to reduce ad dependence, do it gradually. Lower spend on mature products with strong organic rank in small steps, then watch organic sales for two to four weeks before cutting further. The goal is a lower TACoS on the same or higher revenue, not a lower TACoS on a shrinking business.
Conclusion
Amazon TACoS answers the question every seller eventually needs to ask: is my advertising growing the business, or just paying for sales? By comparing ad spend with total revenue, it shows how much of your business depends on ads and whether organic sales are getting stronger over time.
Calculate it carefully, using matching date ranges, every ad type, and a consistent sales figure. Read it alongside ACoS to understand what is really changing. Judge it against your profit margin and product stage, not a generic benchmark. And watch the trend more closely than any single number. A falling TACoS on growing revenue is the clearest sign your advertising strategy is working.
If you want a team that manages your Amazon advertising with TACoS, margins, and organic growth in the same plan, AMZDUDES, a full-service Amazon Agency, can help. Our Amazon PPC services focus on building profitable campaigns that improve efficiency, strengthen organic growth, and reduce your brand’s dependence on paid ads over time.
Frequently Asked Questions
What is a good TACoS on Amazon?
There is no single good number. Common benchmarks put the ideal range at 5 to 10 percent, with most sellers between 10 and 15 percent. But a healthy TACoS depends on your profit margin and product stage. As a rule, keep TACoS below your profit margin before advertising, accept a higher TACoS during launch, and look for it to fall as products mature.
How do I calculate TACoS on Amazon?
Divide your total ad spend by your total sales for the same period, then multiply by 100. Total ad spend includes Sponsored Products, Sponsored Brands, Sponsored Display, and DSP. Total sales include both ad-attributed and organic orders, which you can find under Ordered Product Sales in the Business Reports section of Seller Central.
What is the difference between ACoS and TACoS?
ACoS divides ad spend by ad-attributed sales only, so it measures how efficient your campaigns are. TACoS divides ad spend by total sales, including organic, so it measures how dependent your whole business is on advertising. Use ACoS for campaign decisions like bids and keywords, and TACoS for budget planning and judging overall growth.
Is a lower TACoS always better?
No. A lower TACoS is only good if total revenue is holding or growing. You can lower TACoS instantly by cutting ad spend, but that often reduces sales velocity and organic rank, which shrinks the business over the following weeks. A very low TACoS can also mean you are underinvesting in advertising and missing growth opportunities.
Why is my TACoS going up?
A rising TACoS means ad spend is growing faster than total sales, or total sales are falling while spend holds steady. Common causes include losing organic rank, a stockout, a lost Buy Box, a suppressed listing, a new competitor, a price change, or increased spend on campaigns that are not converting. Check ACoS at the same time to see whether the problem is inside or outside your campaigns.
Should TACoS be tracked by product or for the whole account?
Both. Account-level TACoS is useful for budget planning and overall health. Product-level TACoS shows which items depend most on advertising, which is where you will find listings, pricing, or rank issues to fix. A healthy account average can hide individual products that are losing money.
Can an agency help lower TACoS?
Yes, if it works on both advertising efficiency and organic growth rather than simply cutting spend. A good agency reduces wasted ad spend, improves listing conversion, manages budgets by product, and tracks TACoS alongside revenue and margin. AMZDUDES reports on TACoS, margin, and new-to-brand growth so you can see whether advertising is building lasting sales.