
Looking for the latest Amazon seller statistics and metrics? Our complete guide explains key reports, performance data, and date-range limits in Seller Central to help you grow your business in 2026 and beyond.
As the competition is getting fierce on Amazon with every passing day, it has become crucial to think beyond just listing products. You have to understand and track the elements that drive success, including Amazon PPC metrics and performance indicators.
In this guide, we’ll explore the essential Amazon seller metrics and amazon reports that 3P sellers should focus on to drive growth and optimize their operations in 2026.
Brief Overview of Amazon Seller Metrics
Amazon seller metrics are the data points that provide insights into your business performance on the platform. These metrics cover various aspects of your operations, including sales, customer satisfaction, inventory management, and advertising effectiveness. By analyzing these metrics, you can make informed decisions to improve your performance and achieve your business goals.
Why Seller Metrics Matter for Brands Growth
For 3P sellers, understanding these metrics is key to staying competitive. Metrics help you identify what’s working and what needs improvement. Whether it’s optimizing your listings, managing inventory more effectively, or adjusting your ad campaigns using proper Amazon PPC performance and reporting data, these insights are invaluable for growth.
Key Amazon Seller Metrics for 2026
1. Sales Performance Metrics
The Sales Dashboard in Amazon Seller Central provides a snapshot of your business’s sales performance, offering critical insights into how your products are performing. The dashboard includes key metrics such as:
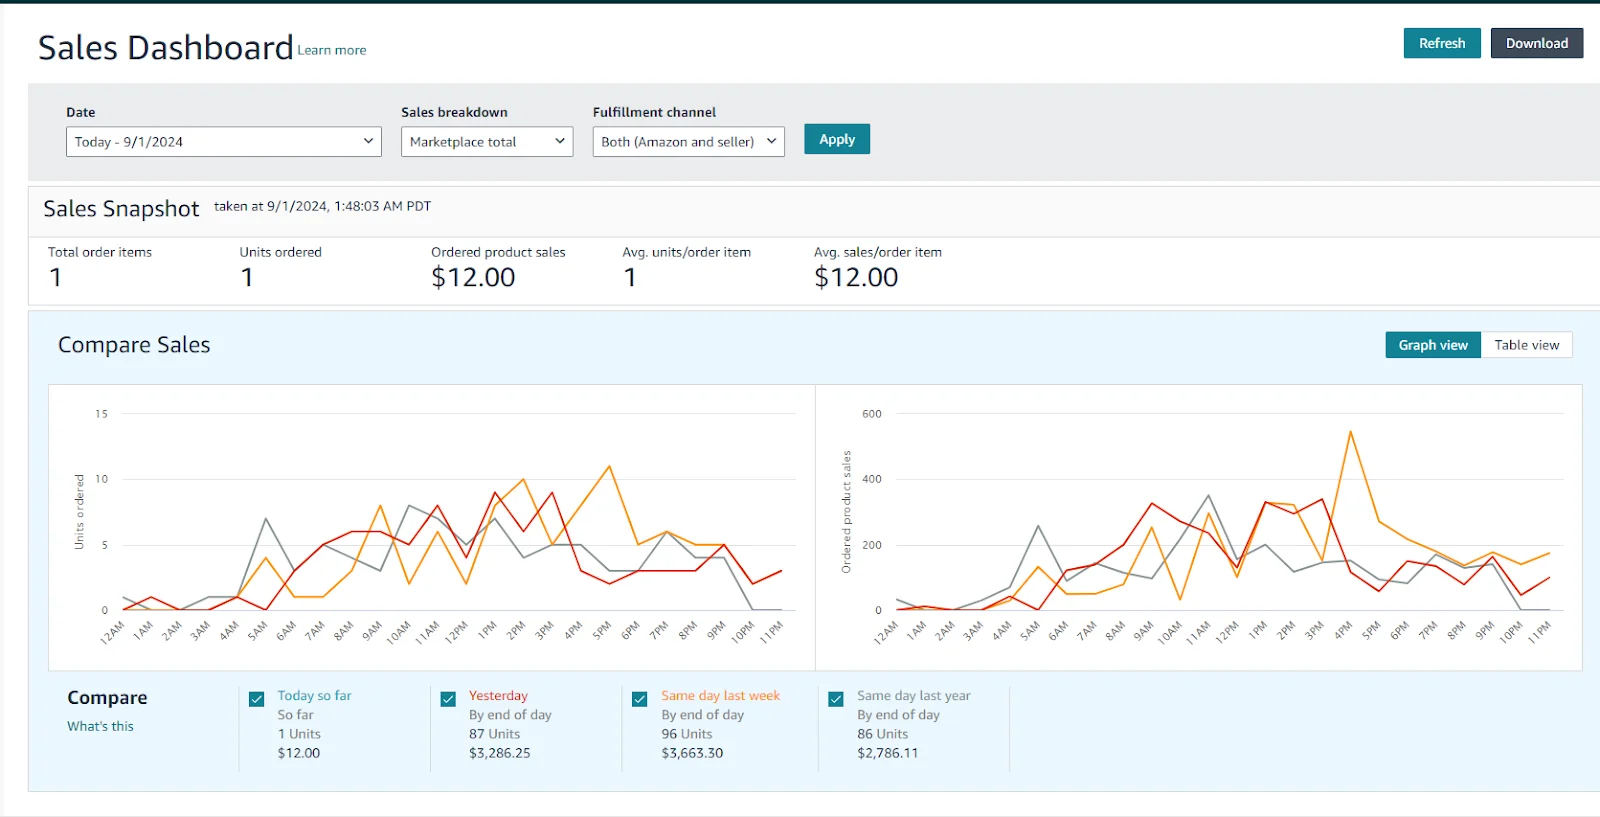
- Total Order Items: Indicates overall demand for your products.
- Units Ordered: Helps pinpoint which products are popular.
- Ordered Product Sales: Reflects your revenue before deductions.
Why It Matters: Regularly reviewing these metrics can reveal trends and help you make data-driven decisions. For instance, if you notice a drop in units ordered, it might be time to revisit your pricing or revamp your strategies so that you can achieve consistent Amazon ad campaign growth.
The “Compare Sales” section lets you analyze sales across different periods, such as comparing today’s sales with yesterday’s or the same day last week, which can help identify trends or unusual activity.
For a deeper dive beyond the Sales Dashboard, use the Amazon Seller Central sales report in Business Reports. Be mindful of its date range limit for accurate period-over-period analysis.

For more detailed sales data, including Gross Sales, you can explore Reports > Business Reports for in-depth analysis. These Amazon business reports are essential for tracking your revenue trends over time.
2. Inventory Management Metrics
The Inventory Performance Dashboard in Amazon Seller Central is essential for keeping tabs on your FBA inventory’s efficiency. The key metric here is the Inventory Performance Index (IPI), which gauges how well you’re handling your inventory based on a few crucial factors.
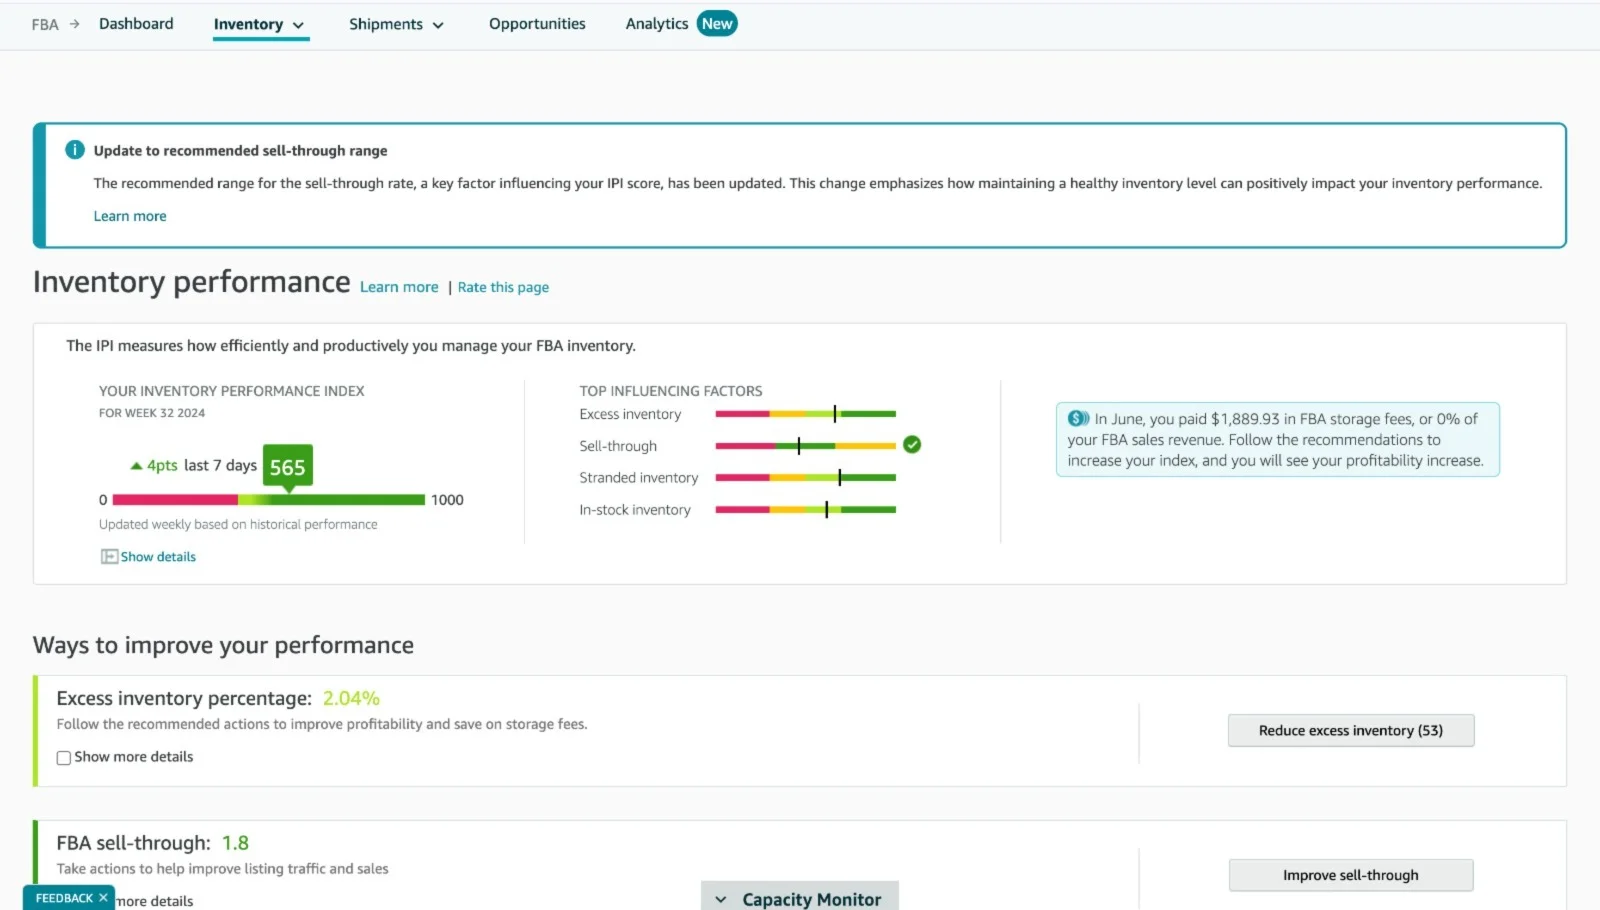
- Inventory Performance Index (IPI): This score, ranging from 0 to 1000, gives you a snapshot of your inventory health. A score above 500 is considered good, while scores below 350 may result in storage limits.
- Key Factors Impacting IPI:
- Excess Inventory: The percentage of stock that exceeds your sales velocity. Reducing this can cut storage costs and improve your bottom line.
- Sell-Through Rate: This shows how fast your products are selling. If it’s low, you might need to adjust your listings and advertising together using listing optimization and PPC integration or consider promotions to speed up sales.
- Stranded Inventory: These are items that aren’t available for purchase due to listing issues. Quickly resolving these can improve your IPI score.
- In-Stock Inventory: Ensuring you have enough products to meet customer demand without overstocking is crucial. Balancing this is key to maintaining steady sales without unnecessary storage fees.
Suggested Actions: The dashboard offers practical steps, such as reducing excess stock and boosting sell-through rates, to help you enhance your inventory performance and increase profitability.
For more detailed inventory performance data, you can explore Inventory > FBA Dashboard > Inventory > Inventory Performance for in-depth analysis.
3. Customer Satisfaction Metrics
Customer satisfaction is a major factor in your success on Amazon. Happy customers are more likely to leave positive reviews, leading to higher conversion rates and better search rankings. Strong metrics here signal to Amazon that you provide a trustworthy experience, which directly boosts your search ranking. This is a core component of Amazon seller performance metrics.
Order Defect Rate (ODR)
- Order Defect Rate (ODR): ODR is a metric that Amazon closely monitors. It includes negative feedback, A-to-Z Guarantee claims, and chargebacks. Keeping your ODR low (ideally below 1%) is essential for maintaining a healthy account status. Monitoring your Amazon seller performance here is critical for long-term success.
Regularly review your ODR and address any issues promptly. Use automated tools to request feedback and resolve customer complaints quickly.
Customer Feedback and Reviews
- Customer Feedback: This includes ratings and reviews left by customers after they receive their products. Positive feedback boosts your product’s visibility and credibility.
- Review Count and Rating: The number and quality of reviews directly impact your product’s ranking on Amazon. High ratings and a large number of reviews are crucial for building trust with potential buyers.

4. Advertising Metrics
The Advertising Dashboard in Amazon Seller Central provides valuable insights into how effectively your ads are engaging potential customers. The screenshot focuses on Funnel Performance Metrics and highlights the Consideration Stage, which is crucial for understanding shopper behavior as they move closer to making a purchase.
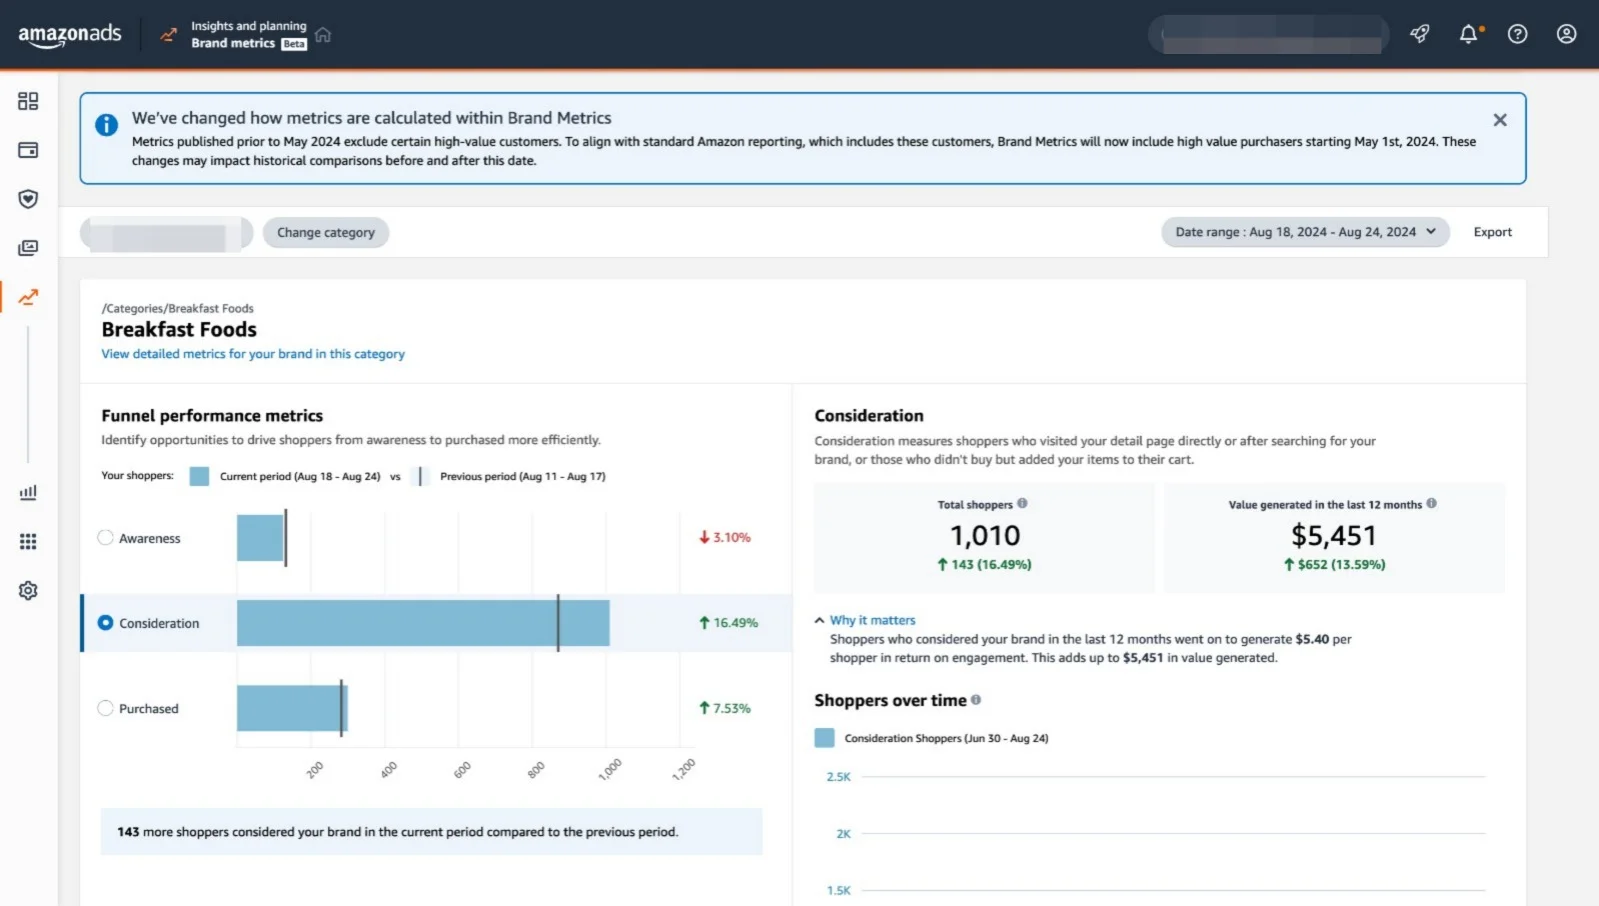
- Funnel Performance Metrics: This section tracks the movement of shoppers through the sales funnel, from awareness to consideration to purchase. It helps you identify where potential customers might be dropping off and where you can improve your advertising strategies, built on a strong Amazon PPC strategy setup.
- Consideration Stage: This metric shows that the shoppers entered the consideration stage, meaning they either visited your product detail page or added items to their cart but didn’t complete the purchase. This metric is crucial because it indicates interest levels and can help you target these shoppers more effectively to convert them into buyers.
- Shoppers Over Time: This metric shows how shopper interest fluctuates over time, allowing you to adjust your campaigns based on peaks and dips in interest.
Using Amazon Seller Reports for Informed Decision-Making
Amazon provides a variety of Amazon reports that offer detailed insights into your business metrics. These reports are invaluable for analyzing performance and making strategic decisions.
1. Business Reports
The Amazon business reports section in Amazon Seller Central, also referred to as Amazon Seller Central business reports, is a vital tool for tracking and analyzing your sales performance. This section offers various reports that break down your sales data by different categories, helping you gain insights into what’s driving your business.
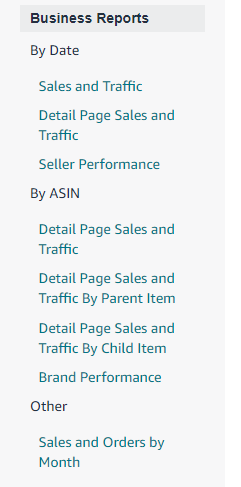
Types of Business Reports:
- Sales and Traffic (By Date): This report provides an overview of your sales and traffic data over a selected date range. It includes key metrics like page views, sessions, and conversion rates, allowing you to monitor your overall performance.
- Detail Page Sales and Traffic (By ASIN): This report breaks down sales and traffic data for individual ASINs, helping you understand which products are performing well and which may need attention. When analyzing this report, remember the Amazon seller central detail page sales and traffic report date range limit of 12 months. For trends beyond that, you’ll need to download multiple reports.
- Detail Page Sales and Traffic By Parent/Child Item: These reports offer insights into how parent and child ASINs are performing. They’re particularly useful for products with variations (e.g., different sizes or colors), enabling you to track performance at both the parent and individual variation levels.
- Seller Performance: Focuses on key seller metrics, such as order defect rate, late shipment rate, and pre-fulfillment cancel rate. The Seller Performance report is your go-to for monitoring Amazon seller performance and seller performance metrics, which are critical for account health. In short, the Seller Performance report is the primary dashboard for tracking seller performance and Amazon metrics.
- Brand Performance: If you’re enrolled in Amazon Brand Registry, this report provides detailed insights into how your brand’s products are performing, including metrics like brand share, customer demographics, and repeat purchase rates.
- Sales and Orders by Month (Other): This report gives a monthly summary of your Amazon Seller Central sales report data and orders, which helps spot trends and plan for seasonal fluctuations.
Understanding Date Range Limits in Amazon Seller Central Reports
A common question sellers have is about the Amazon Seller Central business reports date range limit. Knowing these limits is crucial for accurate long-term trend analysis.
- Standard Date Range: Most standard Business Reports, including Sales and Traffic (By Date) and Detail Page Sales and Traffic (By ASIN), allow you to select a date range of up to one year (12 months or 366 days). This is the Amazon seller central business reports date range maximum for a single report download. Understanding the Amazon Seller Central business reports maximum date range helps you plan your data exports effectively.
- Data Retention: While you can view up to two years of data in some summary graphs, detailed transaction data for reports like Detail Page Sales and Traffic is typically retained and available for download for up to 18 months.
- Best Practice for Long-Term Analysis: If you need to analyze data beyond these limits (e.g., year-over-year comparisons for 2024 vs. 2025), you should download reports in 12-month increments and compile them manually or use a third-party tool. For the most up-to-date information on Amazon’s current data retention policies, always check the official “Business Reports” help page in Seller Central.
2. Inventory Reports
The Amazon Fulfillment Reports section in Seller Central is a crucial resource for FBA sellers to monitor and manage their inventory effectively. These reports provide detailed insights into various aspects of your inventory, helping you make informed decisions to optimize stock levels and reduce costs.
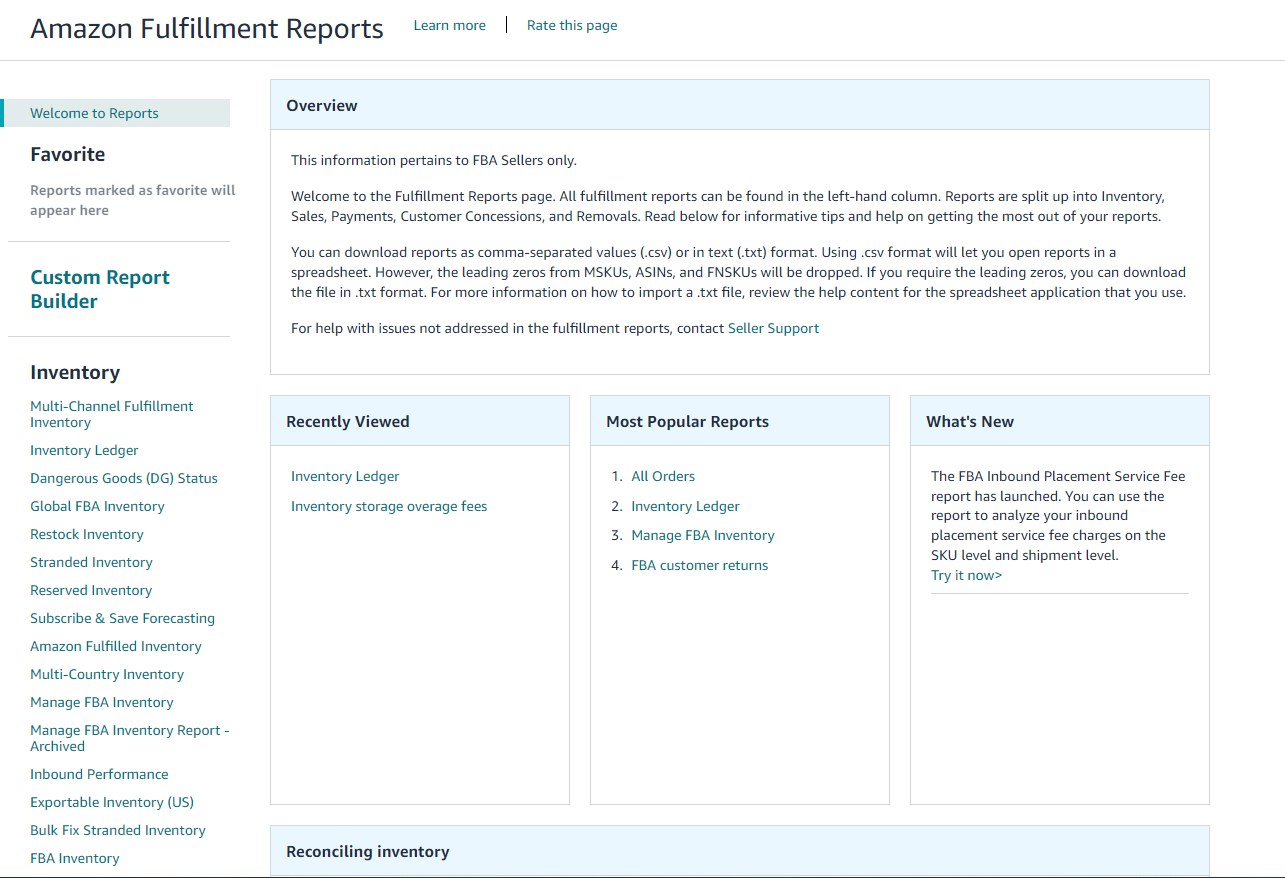
Types of Inventory Reports:
- Inventory Ledger: Tracks all inventory transactions, giving you a clear view of your stock movements, including units received, sold, returned, and removed.
- Restock Inventory: Provides recommendations on when and how much to restock based on your sales velocity and current inventory levels.
- Stranded Inventory: Identifies items that are in Amazon’s fulfillment centers but not available for sale due to listing issues, helping you resolve these quickly.
- Reserved Inventory: Shows inventory that is temporarily unavailable for sale, such as items in the process of being transferred between fulfillment centers.
3. Advertising Reports
The Advertising Reports section within Amazon Ads provides essential insights that help you measure the effectiveness of your advertising campaigns and make data-driven decisions. This section is divided into several key tools and reports designed to optimize your ad spend and improve overall campaign performance.
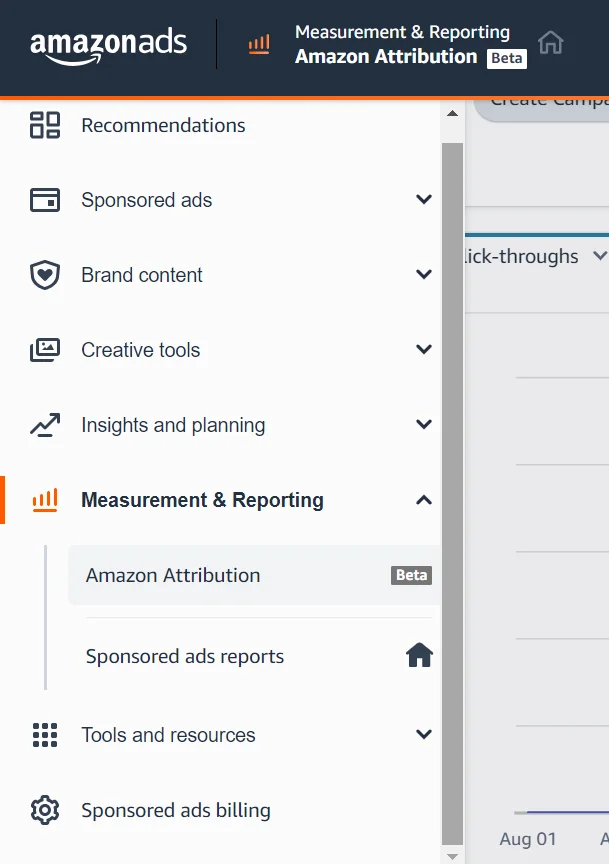
- Amazon Attribution (Beta): This tool allows you to track the impact of your non-Amazon marketing efforts on your Amazon sales. By using Amazon Attribution, you can measure the return on investment (ROI) of external traffic sources, such as social media, email campaigns, or paid search ads, and understand how they drive conversions on Amazon.
- Sponsored Ads Reports: These reports provide detailed metrics on the performance of your Sponsored Products, Sponsored Brands, and Sponsored Display campaigns. Metrics include click-through rates (CTR), conversion rates, impressions, and cost-per-click (CPC). By analyzing these reports, you can identify which ads are performing well and where you might need to adjust your targeting, bids, or creative assets to improve results.
Optimizing for Amazon’s 2026 Algorithm
Amazon’s A10 algorithm continues to evolve, and understanding these changes is crucial for success in 2026:
- Keyword Weight Shift to Title: Amazon’s algorithm now gives significantly more weight to keywords in the title than in backend search terms. Front-load your titles with your most important keywords.
- BSR Algorithm Evolution: Best Seller Rank (BSR) now factors in conversion rate, return rate, and user dwell time, not just sales volume. Focus on creating detailed product listings that keep shoppers engaged.
- External Traffic as a Ranking Signal: Amazon now rewards products that bring traffic from off-platform sources (social media, blogs, email). Use Amazon Attribution to track and prove the value of this external traffic.
- Optimizing for AI Discovery: AI tools like ChatGPT and Google’s Gemini now summarize product information. Write your listings in clear, natural language that answers customer questions directly, rather than using keyword-stuffed sentences.
Conclusion
For 3P sellers, it’s non-negotiable to know all the ins and outs of the Amazon seller metrics and Amazon reports to be profitable in such a crowd. By focusing on key metrics like sales performance, inventory management, customer satisfaction, and advertising efficiency, you can make informed decisions that drive growth and profitability.
Remember, the key to success lies in regularly reviewing your metrics, analyzing your Amazon business reports and Amazon seller central business reports, and making data-driven adjustments to your strategy. Pay special attention to the Amazon seller central business reports date range limit when conducting long-term analysis, and stay updated on Amazon’s evolving algorithm to maintain your competitive edge.
With the right approach, 2026 can be your best year on Amazon yet.
For expert support in optimizing your Amazon business, consider partnering with AMZDUDES for their Amazon PPC management services, as they specialize in helping brands succeed on Amazon.